Harman Kardon HKTS 210SUB (serv.man3) EMC - CB Certificate ▷ View online
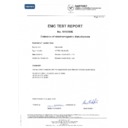
Test report no. 1018989E
Page 13 (13)
8.
VOLTAGE FLUCTUATIONS - FLICKER, EN 61 000-3-3
8.1 Operating environment
Temperature:
21
C
Relative Humidity:
70 %
8.2 Test set-up and test procedure
The voltage changes at the supply terminals were measured using the voltage method.
The test voltage was supplied from an AC source which meets the requirements according to the
standard.
The voltage source has virtually zero internal impedance and is connected to a reference
impedance:
standard.
The voltage source has virtually zero internal impedance and is connected to a reference
impedance:
Z = 0,4 + j0,25
(total impedance)
d
max
is measured at the EUT terminals after the reference impedance.
8.3 Measurement uncertainty
The measurement uncertainty is:
± 9,2 %.
Measurement uncertainty is calculated in accordance with EA-4/02:1997.
The measurement uncertainty is given with a confidence of 95%.
The measurement uncertainty is given with a confidence of 95%.
8.4 Test equipment
Equipment
Manufacturer
Type
Inv. No.
AC Power source
EM test
ACS 500
30605/30604
Power analyzer
EM test
DPA 500
12709
Software
EM test
ISMDPA Version 3.2
AF oscillator
Chung Instruments
555
5211
8.5 Test protocol
Date of test: 9 August, 2010
Test
Measured value
Limit
Pass/Fail
Comments
d
max
(manual switching)
0,33 %
6 %
P
-
d
c
(manual switching)
0,01 %
3,3%
P
-
T (manual switching)
0 ms
500 ms
P
-
dmax = The maximum relative voltage change
dc
dc
= The highest relative steady-state voltage change
d(t)
= The relative voltage change
T
= time where d(t) > 3,3 %

